

ATMResearch
Join Overfit - free

StatOasis · by Ali Casey

Stop guessing. Start building.

Research, build, test, combine, deploy: the loop that turns trader confidence into conviction.

Get the best trading research in your inbox.

Running a quick security check before this can be sent.

Delivered +2 times a month - when the work is ready, not on a calendar.I'll never sell your address.Unsubscribe in one click, any time.

Turn knowledge into process.|

Happy members

Is this you?

live trading beginsIn-sampletraders' backtestOut-of-sampletraders' realitypeaklive trading beginsIn-sampletraders' backtestOut-of-sampletraders' realityIn-sampletraders' backtestOut-of-sampletraders' realitylossgain
Illustrative: a clean backtest is a hypothesis, not proof.
  • 5,800+read OverFitnewsletter
  • 3,500+members inthe community
  • 23,700+subscriberson YouTube
  • 300+ATM studentsglobally
  • 440+videoson YouTube
  • 30+Q&A video sessionsin the community
  • 40+deep diveresearch articles
  • 5,800+read OverFitnewsletter
  • 3,500+members inthe community
  • 23,700+subscriberson YouTube
  • 300+ATM studentsglobally
  • 440+videoson YouTube
  • 30+Q&A video sessionsin the community
  • 40+deep diveresearch articles

The loop most traders skip three steps of.

Five stages, running as a loop - every live strategy feeds the next round of research. The red shortcut is the one most traders take instead.

Most traders follow this path and call it done.
1

Research

Start from a behavioral hypothesis, not a prediction.

2

Build

Turn the hypothesis into rules, not a curve fit.

3

Robustness test

Out-of-sample, walk-forward, across regimes the optimizer never saw.

4

Portfolio construction

Combine strategies that fail at different times.

5

Live deployment

Size it, monitor it, plan the drawdown before it comes.

Most traders follow this path and call it done.

  1. 1

    Research

    Start from a behavioral hypothesis, not a prediction.

  2. 2

    Build

    Turn the hypothesis into rules, not a curve fit.

    ↷ Most traders follow this path and call it done.

  3. 3

    Robustness test

    Out-of-sample, walk-forward, across regimes the optimizer never saw.

  4. 4

    Portfolio construction

    Combine strategies that fail at different times.

  5. 5

    Live deployment

    Size it, monitor it, plan the drawdown before it comes.

back to research

Can you survive a decade of real markets?

A decade of markets. Five decisions. About eight minutes. See how your instincts hold up against the regimes that broke real strategies, then see the trading personality your choices reveal.

Start: Survive the Decade

I'm Ali Casey.

I build systematic trading strategies and teach the workflow behind them. Not a content creator. A system builder who happens to teach.

More about me →
Portrait of Ali Casey

Happy Members

5.0
3.5K+

Algo trader since 2014

Here is how I can help you.

Overfit - the newsletter logoOverfit - the newsletter logo

Overfit - the newsletter

Skip the hype. Trust the data. One practical, evidence-driven takeaway per issue: strategy testing, portfolio construction, market structure, and the mechanics behind systematic trading - every claim with the backtest behind it. Publishing since 2024, formerly The AlgoTrader.

Learn more→
Algo Trading Masterclass logoAlgo Trading Masterclass logo

Algo Trading Masterclass

The complete build-a-system workflow, taught end to end: finding an edge, testing it honestly, assembling strategies into a portfolio, and putting it live - the same process behind every study I publish. Currently open as a waitlist.

Learn more→

Community

Where builders share strategies, code, and feedback. Get plugins, correlation book, indicators and more. Free to join today.

Learn more→

Digital Products

Everything you can download and use the same day: books, strategy packs, and tools - starting with 36 Ways to Buy the Dip, backtested mean-reversion entries for systematic dip-buying, every variant tested, every result shown. Listed on the products page with everything else StatOasis makes.

Learn more→
AlgoChef logoAlgoChef logo

AlgoChef

The validation layer I built for the step most traders skip: pressure-testing a strategy before it risks real money. Launched 2026.

Learn more→

Latest from StatOasis YouTube channel

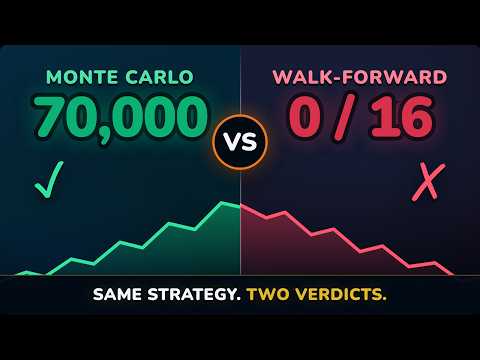
70,000 Monte Carlo Sims Said Yes. Walk-Forward Matrix Said No.

70,000 Monte Carlo Sims Said Yes. Walk-Forward Matrix Said No.

Sep 14, 2026

Almost Everyone Draws The NR4 Pattern Wrong

Almost Everyone Draws The NR4 Pattern Wrong

Aug 31, 2026

The "Dumb Money" Beat the Smart Money (4,889 Backtests)

The "Dumb Money" Beat the Smart Money (4,889 Backtests)

Aug 3, 2026

Latest from StatOasis X channel

StatOasis card. The setup that matters. Buy the dip beats chase the breakout. Two bars compare mean-reversion, 55.7% of variants profitable at a 20.8% max drawdown, against breakout, 42.9% at 59.6%. Mean-reversion wins 68.8%.

33,792 backtests of RSI vs Stochastic vs Williams %R: the three tie as mean-reversion longs — 100.0%, 99.8%, 89.6% of variants profitable. The real split is the setup. Long variants 89.7% profitable, short 8.8%. Full three-way study: https://statoasis.com/overfit/research/rsi-vs-stochastic-vs-williams-r

Sep 25, 2026 · 73 impressions · 3 reactions
StatOasis card. Which oscillator wins? Wrong question. Across 33,792 backtests on three oscillators, 89.7 percent of long variants are profitable, set as the one large figure on the card, against only 8.8 percent of the same strategies run short. Direction beats indicator.

I ran 33,792 backtests to settle it: RSI vs Stochastic vs Williams %R, on four US index ETFs. The question "which oscillator is best?" turned out to be the wrong one. Here's what actually decides it. 🧵

Sep 24, 2026 · 95 impressions · 4 reactions
Card headlined 'Three ADX rules, tested. Two held. Direction did not.', subtitled 8,370 SPY days, 4,889 ES days, 3,780 variants each. Three tiles: 89% of SPY days at ADX 30 to 40 later touch plus 1%, up from 78% under ADX 15, the rule that ADX sizes the move, held; a median CAR/MaxDD of 0.18 at ADX 40 and above against 0.01 under ADX 15, the rule that ADX works as a long-side filter, held; and a SPY 5-day return of 0.232% after a bearish reading against 0.174% after a bullish one, the DI direction rule, failed, singled out as the finding the card turns on. Callout: out of 3,780 variants the single strongest stable region is long inside the bearish DI state at ADX 40 or above, 10 reliable variants, 100% profitable, median CAR/MaxDD 0.22.

I tested the three ADX rules everyone repeats, on 8,370 SPY days and 4,889 E-mini days. Two held up. The one about direction didn't. The strongest region out of 3,780 variants was long inside a "downtrend" reading. Everything you need is here: https://statoasis.com/overfit/research/how-to-use-the-adx-indicator-like-a-pro-step-by-step-guide

Sep 23, 2026 · 126 impressions · 2 reactions

Latest from LinkedIn

StatOasis card. The deeper the fall, the longer the climb back. Four bars, median calendar days from the trough back to a new high by depth of fall: 10 to 20 percent 94 days across 15 episodes, 20 to 30 percent 386 days across 6, 30 to 40 percent 639 days across 5, 40 percent or more 1,638 days across 6, the two deepest picked out as the standouts.

"How far can it fall" is the question people ask. "How long until it comes back" is the one you actually live with. We measured every S&P 500 drawdown of 10% or more since 1871, 32 episodes in all, and timed each from its low back to a new high. Sort them by depth and the waiting time sorts itself. - Falls of 10% to 20%, 15 episodes: median 94 calendar days back to a new high. - 20% to 30%, 6 episodes: 386 days. - 30% to 40%, 5 episodes: 639 days. - 40% or deeper, 6 episodes: 1,638 days. Pool every episode 15% or deeper and split it by era. The 6 that finished before 1950 took a median 1,112 days to get back. The 15 since took 337. Those are two pooled medians. They say recoveries since 1950 have been faster across all depths together, not which rung of the ladder moved. And the deep end is thin. Six episodes is six episodes. If you are sizing around the worst case, read 1,638 days as a sense of scale, not a forecast. Every drawdown since 1871, depth and recovery time side by side: https://statoasis.com/overfit/research/sp500-drawdowns-since-1870

Sep 26, 2026
StatOasis card. 33,792 backtests · 3 oscillators. Which oscillator wins? Wrong question. 89.7 % of LONG variants are profitable.

33,792 backtests later, "which oscillator is best?" turned out to be the wrong question. I ran RSI, Stochastic and Williams %R against each other on four US index ETFs — SPY, QQQ, IWM and DIA — across mean-reversion and breakout, long and short, every combination. Then I asked the same question everyone asks: which indicator wins? They tie. As a mean-reversion long, 100.0% of Williams %R variants were profitable, 99.8% of Stochastic, and 89.6% of RSI. Median R-expectancy across the three: 0.20, 0.20, 0.18. Three different formulas, one edge. What actually separated winners from losers wasn't the oscillator. It was the setup: 89.7% of long variants were profitable versus 8.8% of short ones. The indicator is a detail. The setup is the decision. Full three-way breakdown: https://statoasis.com/overfit/research/rsi-vs-stochastic-vs-williams-r

Sep 25, 2026
StatOasis card. The mirror-image trap. A 100% win rate that means nothing. 100% Win rate; 5 Trades; $1,900 Net profit; <50 Trades in every top-10 win rate. Five coin flips landing heads is not a biased coin. Check the trade count before the win rate.

The win-rate statistic failed in both directions in the same study — and each failure is a lesson. We ran 1,856 RSI-family backtests across SPY, QQQ, IWM, and DIA. Sort the results by win rate and look at both ends of the leaderboard: The top: a plain-RSI configuration on QQQ with a 100% win rate. Perfect record. It took 5 trades in 27 years and made $1,900. Every single one of the ten highest win rates in the grid sits below 50 trades — which is exactly why the engine flags anything under that threshold as unreliable instead of celebrating it. The middle: a short-side configuration on IWM with a 60.6% win rate across 582 trades — a genuinely large sample — that lost $4,592. Wins six trades in ten and still loses money, because the average loser is bigger than the average winner. So a win rate can lie two ways: a perfect rate on a sample too thin to mean anything, and a good rate whose losers quietly outweigh its winners. The two numbers that keep it honest are the trade count and the win/loss size ratio — and neither ever appears in a screenshot. Full study — four RSI families, 1,856 variants, every number traceable: https://statoasis.com/overfit/research/better-rsi-backtest

Sep 24, 2026

What you won't find here.

No trade calls. No daily predictions. No PnL screenshots. This is for traders who want to understand how to build trading systems, how they behave in different market regimes, when they break, and why. If that's not you, there are plenty of other places, and no hard feelings.

What traders say.

rodolfo berrocal's photo

rodolfo berrocal

Hello, my name is Rodolfo Berrocal, I'm from Lima, Peru. I just stopped by to thank you for all the great work you do. I'm doing my best to understand your videos since I don't speak English very well, but I'm still learning a lot from you. I'm just getting started in the world of algorithmic trading, and it's going well for me. Thank you again, and blessings.

Tommy's photo

Tommy

Dear Ali, your attention to detail - and people - was always bar none. No question, you are our Financial Guru, while also a loving/caring figure so you deserve our utmost respect! Thank you for all your shared experience and everyday hard work for our not-only-financial wellfare! :)

Chad's photo

Chad

I’ve been in the program since Feb, have found a way to create and find a lot of pretty good algos, but magic sauce happens when we combine the uncorrelated “pretty goods”. Happy to report since Feb, up 28pct and am now in maintenance mode working on the process instead of reflexively reacting to every draw down that I think is the end of the world. Biggest learnings. Test for worst case portfolio drawdown, size accordingly. Trade top strategies within that portfolio, cycle out worst performers every few months. Seems to be a winning recipe and am so excited to think about the next chapter in this journey I’ve been on for many many moons 😃

Read more →

StatOasis is calm, evidence-based algorithmic-trading education, founded by Ali Casey. Ali builds systematic trading strategies and teaches the workflow behind them: research, build, test, combine, deploy. He writes the Overfit newsletter, published since 2024, and runs the Algo Trading Masterclass.

Socials

  • X ↗
  • YouTube ↗
  • Instagram ↗
  • LinkedIn ↗
  • GitHub ↗
  • Muck Rack ↗
  • LinkedIn SO ↗
  • GitHub SO ↗

Products

  • Overfit - the newsletter
  • Algo Trading Masterclass
  • StatOasis Community
  • 36 Ways to Buy the Dip
  • AlgoChef ↗

Reading & tools

  • Research
  • Methodology
  • Survive the Decade
  • Wall of Love

StatOasis

  • About Ali Casey
  • Contact
© 2026 StatOasis. Calm, evidence-based.
PrivacyTermsHypothetical resultsCalifornia